
There are a lot of homicides in Washington, D.C.
While it’s come a long way since the dark days of the late 80s and early 90s when it had the ignominious sobriquet of “The Murder Capital,” DC — the city of my birth and one of my favorite places on earth — has suffered from a high murder rate for years and years.
And now we’ve been in the throes of COVID.
At this point, it’s relatively common knowledge even outside the criminology community that the murder rate in U.S. cities has exploded over the past two years. No one is entirely sure why, but it’s happening just about everywhere, even while other crime rates continue to fall.
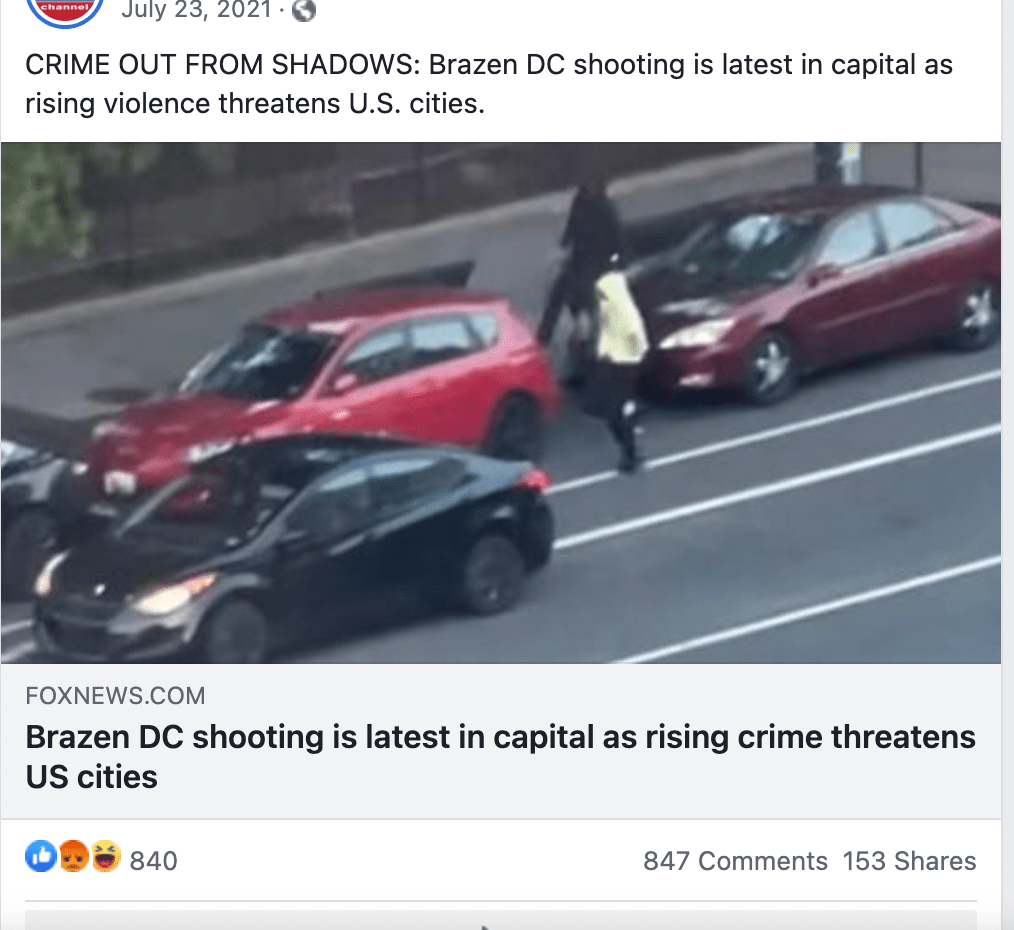
But what about DC? What has changed here? Is there any truth the pop culture suggestion that crime has gotten totally brazen, out of control, and that previously safe enclaves are being overrun by criminals?
I got to wondering about this bit of popular “truth,” and like a good little data analyst, I know that I needed to get from wondering amorphously to narrowing down specific variables to measure. I decided to take a look at whether two variables — time and location —has been “business as usual” for intentional homicides in DC, or whether there have been any changes since the pandemic began.
Has the pandemic “caused” something about the time and geography of homicides to change?
Now, I have had enough scientific training to know that this is an incredibly problematic statement. I can hear myriad professors/mentors/advisors screaming at me:
CORRELATION DOES NOT IMPLY CAUSATION!
Yes, I know.
But for now, let’s just see, even in a somewhat generic way, if anything about the time and location of murders in Washington, D.C. changed over three years, from 2019, 2020, to 2021. To examine this in a general way, I’ve decided to use two variables: for time, I’m going to use D.C. Metropolitan Police Department work shifts, which I will define specifically later. For geographic location, I will use the municipal wards, of which D.C. has eight. On a map, they look like this:

Frankly, despite the popular conception that there has been a rampant spread of crime everywhere and at all hours of the day due to the pandemic, I don’t much has changed in terms of time and geography of murders in D.C. except the overall count of homicides have gone up.
The social problems and stratification that D.C. suffers from have proven fairly intractable. In recent memory, the majority of homicides in D.C. have taken place in the economically depressed eastern half of the city. And historically, as is common everywhere, the majority of homicides take place at night. It will be interesting to see, however, if there is any change in the time of day of homicides committed in DC. A lot of people have lost jobs since the pandemic started, and a lot of schools are doing virtual classes, both of which are situations that could provide ripe opportunities for crime to occur.
Let me say, though, that even if my tone sounds light that I definitely I do not take of this lightly. Not that it bequeaths me some kind of incredible insight, but I was a teacher in D.C. for a while. I fairly regularly saw students fall victim to the scourge of violence. It was usually senseless, gang-related street violence. Occasionally, they were even the perpetrators. But with a few outlying exceptions, these were really good kids, normal kids, some of whom were stuck in bad situations. And frankly, in more ways than one, I had the privilege to be on the outside looking in: if you’re white (like me), it is unlikely you will be the victim of a violent crime in D.C.
The data will show this pretty easily. Let’s take a look.
Let’s compare the violent crime totals for the three biggest racial/ethnic groups in D.C.: black, white, and Hispanic/Latino.
(Of note is that, until the 2020 Census, Hispanic/Latino was not considered a separate “Race” by the Census Bureau. As such, all people who considered themselves ethnically Hispanic/Latino also had to choose a race, which renders the data a little more confusing. This is no longer true as of the 2020 Census, but for that reason I chose to focus on these categories.)
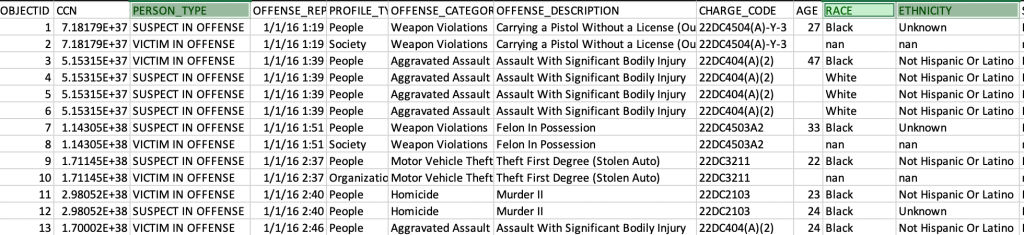
I grabbed the Felony Crime Incidents in 2016 dataset (https://opendata.dc.gov/datasets/DCGIS::felony-crime-incidents-in-2016/about) as an example. It is a few years old, but it is much more detailed than more recent available datasets in terms of demographic information. I converted the standard .csv into an .xlsx file for ease of use.
We can see that there is a column “PERSON_TYPE” that has two primary variables “SUSPECT IN OFFENSE” or “VICTIM IN OFFENSE.” We can also see that there are two columns “RACE” and “ETHNICITY” which hold those two variables.
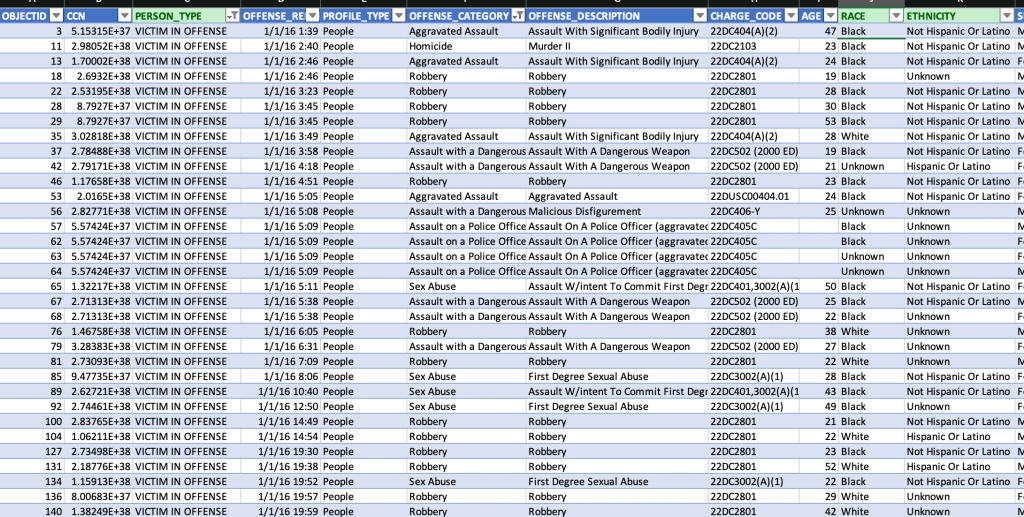
If we turn this range into a table and do a filter on PERSON_TYPE to only include victims, if we look at the RACE and ETHNICITY columns, even with the naked eye we start to see a trend. And this is without sorting for type of crime or anything like that.

Now I’ll filter just for victims of violent crimes and the picture becomes clearer.
Here is a pivot table that shows the key values highlighted.

- Hispanic or Latino (any race): 1,056
- White (Not Hispanic or Latino): 709
- Black (any ethnicity): 5,738
Though demographics of the city are changing, in 2021 D.C. was 46% black, 46% white, 11.6% Hispanic, and 4.5% Asian. That means that even though the proportions of black and white residents are roughly equal (though there were slightly more black residents in 2016), the violent crime rate was roughly 809% higher than that of white residents. And even though the Hispanic/Latino population is roughly one quarter the size of the white population, there were still 347 more total Hispanic/Latino victims of violent crime than whites, at a rate of victimization around 580% that of white residents.
Obviously, the situation is not equal.
That being said, let’s now take a look at the homicide data in D.C. over the past three years, taking a special look at time of day and geographic location.
<<<<<>>>>>
First, I located the data and Open Data DC and downloaded three .csv files corresponding to each year (“Crime Incidents in 2019,” and for 2020, and 2021, respectively).
I deleted the unnecessary columns for our analysis. I also placed “OBJECTID” in the first column as this might make later SQL queries (if necessary) a little bit clearer.
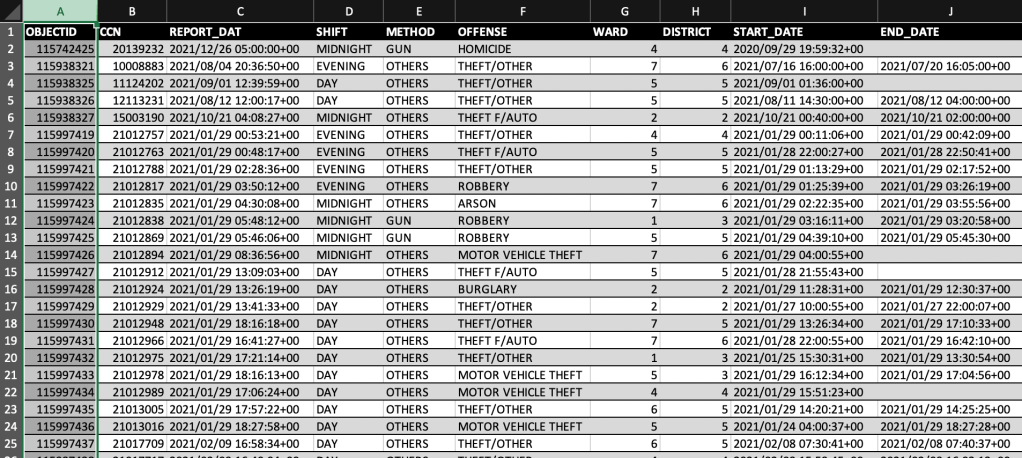
I was left with the following columns:
- OBJECTID
- CCN (Police report number)
- REPORT_DAT (Date and time of report)
- SHIFT (Police work shift)
- METHOD (Method used in crime)
- OFFENSE (Type of crime)
- WARD (Municipal ward)
- DISTRICT (Police district – confusingly similar, but slightly different geographic boundaries than ward)
- START_DATE (?)
- END_DATE (?)
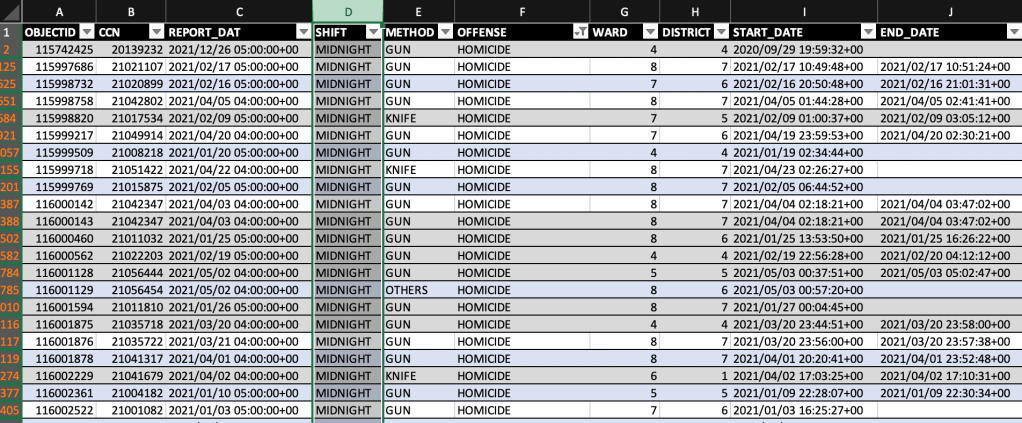
I inserted the data into a table, sorted by “OFFENSE – Homicide” and I noticed that for “SHIFT”, all of the homicides were sorted into “MIDNIGHT.” Despite night being a prime time for crime, I knew this couldn’t be right. I looked towards the columns START_DATE and END_DATE, and after some digging, I realized these were the actual estimated dates and times for the actual incidents and/or the initial scene investigations, rather than the official report.
All of this means some more data cleaning needs to be done to clarify the actual shift times of the homicides. I decided to use START_DAT as my benchmark for determining during which shift murders occurred. I removed REPORT_DAT, SHIFT, and END_DATE, and I reorganized the columns to make things a little bit easier. I decided to also remove CCN just to make things easier.

Much more manageable.
Now, I need to split the START_DATE column into DATE and TIME columns and make the formatting a little easier to read. I undo the table a run a couple handy RIGHT and LEFT functions in Excel to get the dates and times split up.

Now I add the table back in, sort out just the homicides, and copy the homicide-only data to a new sheet. Now our data is pretty clean.

Now I need to find out what the MPD police shifts are. I don’t want to rely on the original table’s demarcations of shift times, so I go onto MPD’s website. I find a breakdown of the datatypes on Open Data DC, and I learn that the shift times are as follows:
- Day shift: 07:00-14:59
- Evening shift: 15:00 and 22:59
- Midnight shift: 23:00 and 06:59
I’m going to add some filters onto the Excel file in order to isolate the times and add the shifts in accordingly.

Now my data is pretty darn clean. (I even fixed the fact I spelled “TIME” wrong — did YOU catch that?) I’m going to save this file and upload it into Tableau Desktop.
First, I assigned each ward a column on the X axis. Then I made the Y axis the total murder count. Finally, I added colors to indicate which shift the homicides occurred on. The default colors were basically the opposite of what I wanted (Day was dark blue, Midnight was yellow — doesn’t make much sense), so I customized them to make them more logical for the times of day. I also used colors to make them appropriate for colorblind people looking at the data viz.
Looking better:

Now I’m going to clean and upload the other two datasets. (I’ll spare you the pleasure of walking through each step again of doing that again.)
For ease of use, I combined the separate .xlsx files for each year into one file with three sheets. This makes it easier to link it with Tableau. I then linked all the datasets together by ward and shift, and then I added some labels and reference lines. First I put them all together on one graph.

Then I split them up into three different graphs, cleaned up the reference lines and added grand totals. I then put them all on one dashboard for ease of comparison.

Taking an initial glance, there are no immediately discernible proportional changes between the years that jump off the page. With regards to police shift, the daytime homicides appear to have only slightly increased since 2019, and have then decreased from 2020 to 2021.
However, what is noticeable is the sheer increase in amount of homicides overall. This is especially true in wards 7 and 8, but in other wards as well: Ward 2 had no homicides at all in 2019, nine in 2020, and seven in 2021; Ward 4 went from six (2019) to nine (2020) to 20 (2021).
A deeper dive into statistical analysis of these data would probably reveal more trends, especially if we included other years prior to 2019 and got a little more into the nitty-gritty of exact times. But as expected, other than a gross increase in the amount of homicides overall, it is pretty safe to say that there has not been much of a proportional change in the police shift and ward in which most homicides take place in D.C.
