-
Breaking down COVID-era murders in D.C. by time and place: Is anything changing?

There are a lot of homicides in Washington, D.C. While it’s come a long way since the dark days of the late 80s and early 90s when it had the ignominious sobriquet of “The Murder Capital,” DC — the city of my birth and one of my favorite places on earth — has suffered from…
-
What percentage of young adults used drugs in 2019-2020?

I made this quick and dirty dashboard out of some SAMHSA datasets on drug use. (For you data tech stack nerds out there, I mainly used Tableau — as you can probably tell — and Excel for this, but there was even a bit of SQL and Python for this. I probably could have just…
-
Crazy shipping costs at Global Superstore [Tableau]
![Crazy shipping costs at Global Superstore [Tableau]](https://datadebased.com/wp-content/uploads/2022/07/image-1.png?w=1024)
Ah, the [in]famous Global Superstore. If you’ve learned and practiced Tableau, you have likely come across this legendary dataset, comprised of fake information from some imaginary global superstore. Accordingly, the imaginative proper noun title they have given to this global superstore is Global Superstore. Succinct. While messing around with this data, I started to realize…
-
Fun with Credit Card Fraud Data Viz in R!
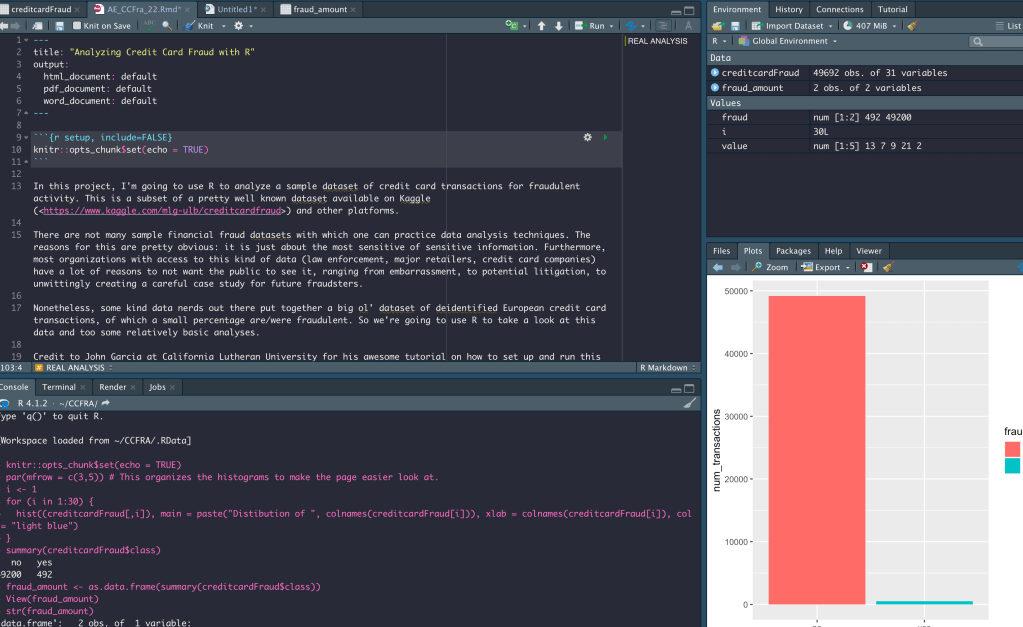
NOTE: This post is available in a much more aesthetically pleasing and interactive format over at https://www.kaggle.com/alexepperly/analyzing-credit-card-fraud-with-r-part-i. You should totally go there instead. Don’t be stubborn. Do it. Still here, huh? Well, I suppose you are lazy, like the rest of those people on the internet. This is what my R Studio looks like. Just…
-
Crime data in D.C.: What weapons are being used?
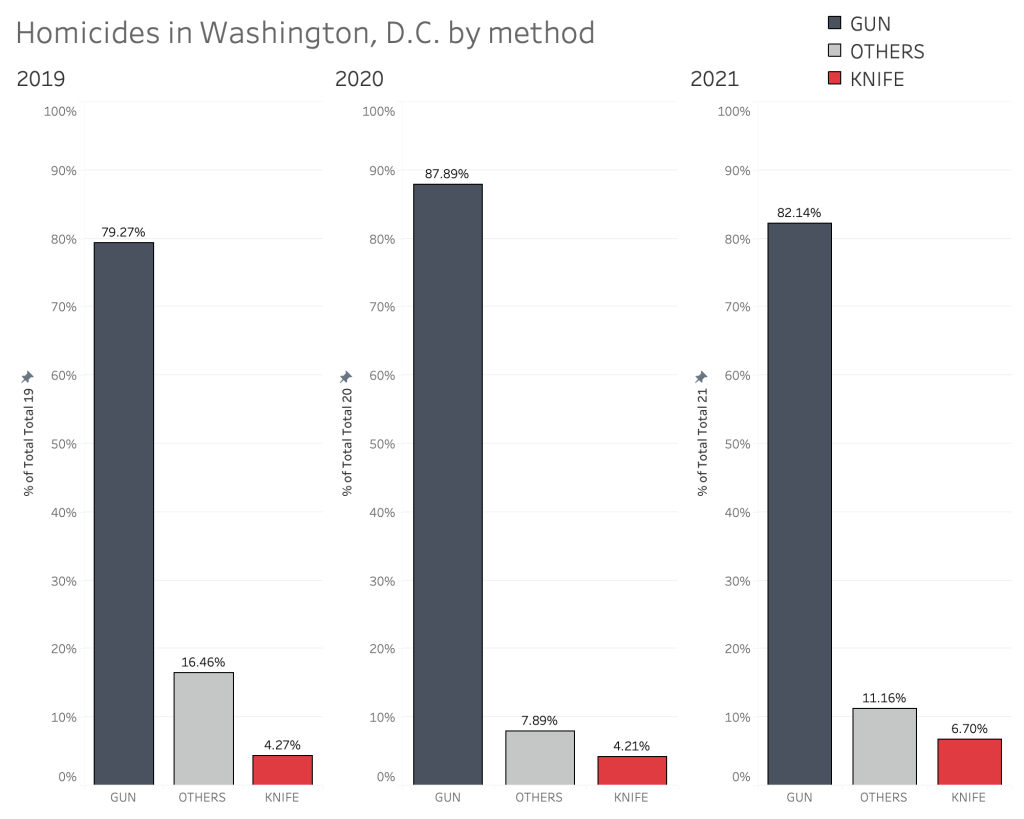
After I finished up the last project on DC’s homicides by police work shift and ward, I decided I wanted to use SQL to clean the data a little more, and this time analyze the method used to commit the homicides. The three variables possible in this dataset for method are: Gun Knife Others “Others”…
-
Subscribe
Subscribed
Already have a WordPress.com account? Log in now.
